
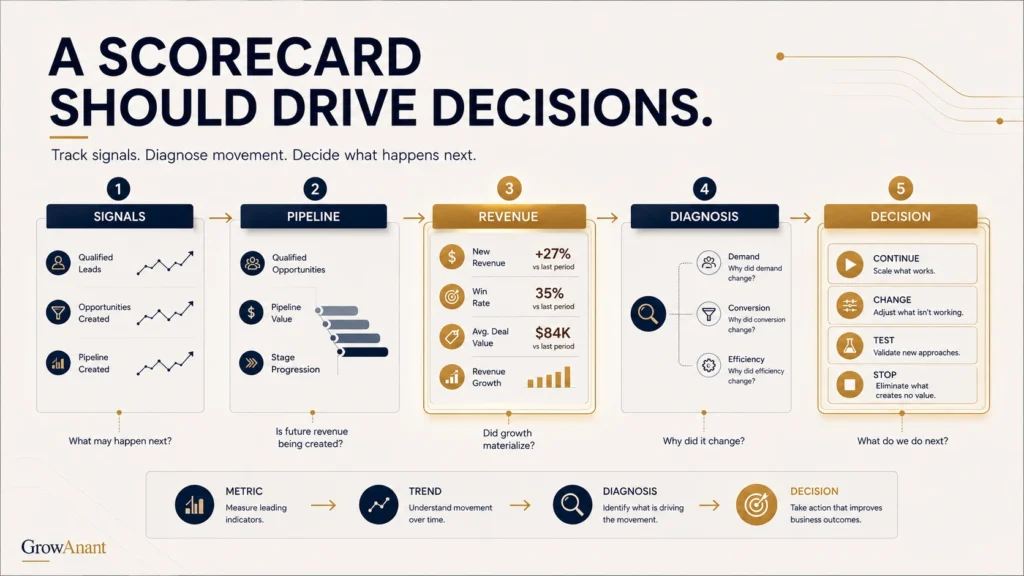
A strong fractional growth leadership kpis framework should show more than how many campaigns were launched or leads were generated. It should help CEOs and growth leaders understand whether strategy, demand generation, customer acquisition, pipeline, and revenue are moving in the right direction.
For a fractional growth consultant or fractional head of growth, the monthly scorecard creates a common operating language between leadership, marketing, sales, and execution teams.
The objective is simple:
Connect growth activity to business outcomes, identify problems early, and make better decisions every month.
A useful scorecard should therefore track both leading indicators, which signal what may happen next, and lagging indicators, which show what has already happened.
Why a Monthly Scorecard Matters
Growth becomes difficult to manage when leadership receives disconnected reports from different functions.
Marketing may report traffic and leads. Sales may report meetings and opportunities. Finance may report revenue. Leadership then has to determine whether these numbers tell one coherent story.
A monthly scorecard solves this by bringing the most important measures into one view.
A good scorecard helps answer five questions:
- Are we creating sufficient demand?
- Are qualified prospects entering the pipeline?
- Is the pipeline converting efficiently?
- Is revenue performance improving?
- What needs to change next month?
This is particularly important when a fractional growth executive is coordinating multiple functions without owning every internal team directly.
Salesforce’s executive pipeline dashboards, for example, emphasize pipeline value, pipeline coverage, average deal size, closed-won performance, and period-over-period comparisons.
The scorecard should not become a reporting exercise. It should become a decision-making system.
Monthly Scorecard Principle
Metric → Trend → Diagnosis → Decision → Owner
If a metric changes but nobody knows what action follows, the metric has limited management value.
Leading vs Lagging Indicators
The difference between leading and lagging indicators is essential for effective fractional growth leadership.
Leading indicators provide signals about future performance.
Examples include:
- Qualified website conversions
- Sales meetings booked
- Marketing-qualified accounts
- Sales-qualified opportunities
- Pipeline created
- Opportunity progression
- Lead response time
- High-intent engagement
Lagging indicators show completed business outcomes.
Examples include:
- Revenue
- Closed-won deals
- Customer acquisition cost
- Gross margin contribution
- Customer retention
- Win rate
- Average deal value
| Indicator Type | Example | Management Question |
| Leading | Qualified opportunities | Are future deals being created? |
| Leading | Pipeline generated | Is demand translating into commercial opportunities? |
| Leading | Stage progression | Are prospects moving forward? |
| Lagging | Revenue | Did growth materialize? |
| Lagging | Win rate | Did opportunities convert? |
| Lagging | CAC | What did acquisition cost? |
A useful growth scorecard template should contain both categories.
For example, a B2B SaaS company could have strong website traffic and lead volume but declining opportunity creation. That suggests the problem is not awareness. It may be lead quality, qualification, positioning, sales follow-up, or funnel leakage.
The scorecard should make that distinction visible.
Revenue Metrics to Track
Revenue metrics should remain at the center of the scorecard because growth leadership ultimately exists to improve business performance.
The exact metrics depend on the business model, but a practical executive set includes:
| Revenue KPI | What It Shows |
| New revenue | Commercial output from new customers |
| Recurring revenue | Revenue base for subscription businesses |
| Average deal value | Economic value of acquired customers |
| Win rate | Effectiveness of opportunity conversion |
| Sales cycle | Speed from opportunity to revenue |
| Customer acquisition cost | Efficiency of acquisition investment |
| Revenue growth | Direction and pace of commercial performance |
Do not track every available revenue metric.
Instead, select the metrics that directly support the current growth priority.
For example:
- A startup validating its market may prioritize qualified opportunities and win rate.
- A scaling SaaS company may emphasize recurring revenue, CAC, pipeline coverage, and sales velocity.
- A professional services firm may prioritize qualified leads, proposal conversion, average engagement value, and new revenue.
This is where growth strategy consulting adds value. The scorecard should reflect the company’s strategic priorities, not simply reproduce whatever metrics the CRM happens to provide.
Pipeline & Conversion Metrics
Revenue is a lagging outcome. Pipeline explains the potential behind that outcome.
A monthly scorecard should therefore connect:
Demand → Qualified Leads → Opportunities → Pipeline → Closed Revenue
Important pipeline metrics include:
- Qualified leads generated
- Sales-qualified opportunities
- Pipeline created
- Pipeline value
- Pipeline coverage
- Stage-to-stage conversion
- Win rate
- Average deal size
- Sales cycle length
- Pipeline velocity
Salesforce’s B2B marketing analytics framework similarly connects visitors, prospects, MQLs, SQLs, opportunities, closed-won business, conversion rates, and pipeline value.
For a demand generation agency or internal growth team, this connection is critical. Generating 500 leads is not necessarily positive if only five become qualified opportunities.
Example
Suppose a B2B software company generates:
- 300 leads
- 60 qualified leads
- 20 opportunities
- 5 closed deals
If lead volume increases to 450 but opportunities remain at 20, the growth team should investigate qualification and conversion rather than celebrate lead growth alone.
The scorecard should make this funnel leakage obvious.
Building Your Scorecard
A practical fractional growth leadership kpis scorecard can be built around five categories.
| Category | Monthly KPIs |
| Demand | Qualified leads, high-intent conversions |
| Pipeline | Opportunities, pipeline created, coverage |
| Conversion | Stage conversion, win rate, sales cycle |
| Revenue | New revenue, recurring revenue, average deal |
| Efficiency | CAC, acquisition efficiency, marketing contribution |
Keep the executive view compact.
Scorecard Rules
1. Assign one owner to every KPI.
A metric without ownership becomes nobody’s responsibility.
2. Track trend, not only the current number.
Compare against the previous month, quarter, and relevant target.
3. Separate signal from noise.
A single month’s movement may not justify a strategic change.
4. Add commentary.
Every significant change should have an explanation or investigation owner.
5. Connect metrics to decisions.
If pipeline quality falls, identify the action. If conversion improves, determine what should be repeated.
For a company using growth consulting services, the scorecard can also help leadership determine whether strategic recommendations are translating into measurable commercial movement.
GrowAnant’s strategy-first approach can use this type of operating framework to connect business growth consulting, demand generation, go-to-market execution, and revenue accountability rather than treating each channel as an isolated activity.
Reviewing Results With Leadership
The monthly review should not become a 90-minute reading exercise.
A better structure is:
1. What changed?
Identify the biggest movements in revenue, pipeline, conversion, and efficiency.
2. Why did it change?
Separate known causes from assumptions requiring further investigation.
3. What matters most?
Prioritize the two or three issues with the greatest potential business impact.
4. What decision is required?
Decide whether to continue, stop, change, test, or investigate.
5. Who owns the next action?
Every decision should have an accountable owner and timeframe.
A simple leadership review might look like this:
| Question | Example |
| What improved? | Opportunity conversion increased |
| What declined? | Qualified pipeline fell |
| Why? | Lower-quality acquisition source |
| Decision | Shift acquisition focus |
| Owner | Growth lead |
| Review | Next monthly meeting |
This creates accountability without turning the scorecard into a performance-ranking exercise.
The strongest growth leadership team structure uses the scorecard as a shared operating system across marketing, sales, leadership, and revenue operations.
The goal is not to produce more dashboards. It is to create better decisions.
Frequently Asked Questions
The most important KPIs are those connecting strategic activity to commercial outcomes. Typically these include qualified pipeline, pipeline created, conversion rates, win rate, sales cycle, acquisition efficiency, and revenue. The exact mix should reflect the company’s current growth constraint.
A monthly executive review is generally useful for strategic decision-making, while operational teams may monitor selected leading indicators weekly. The important point is to maintain consistent definitions and avoid changing metrics simply because a result is unfavorable.
Leading indicators provide signals about future performance, such as qualified opportunities or pipeline creation. Lagging indicators measure completed outcomes, such as closed revenue, win rate, or customer acquisition cost. Effective growth management requires both.
Yes. The scorecard should evolve as the company’s strategy, growth stage, and constraints change. However, core definitions should remain stable enough to preserve meaningful historical comparisons.