
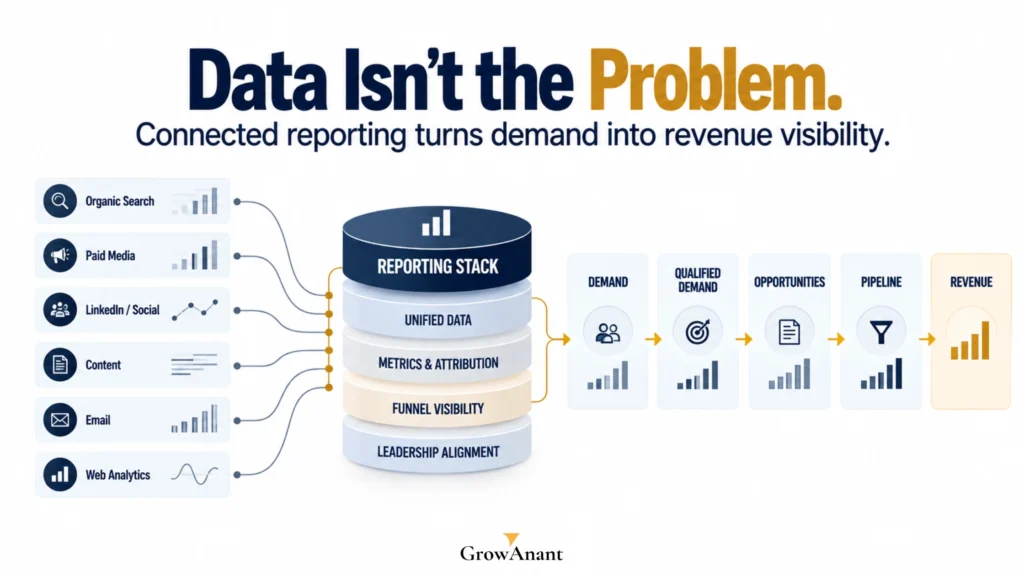
Leadership does not need more marketing data. It needs a reliable explanation of how marketing activity contributes to pipeline, revenue, and business growth. That is the purpose of demand generation analytics.
For B2B companies, the challenge is rarely a lack of dashboards. Marketing teams often have website data, advertising metrics, CRM information, campaign reports, sales activity, and content performance data spread across multiple systems. The problem is determining which numbers actually matter.
A useful analytics system connects b2b demand generation metrics to business outcomes. It helps leadership understand where qualified demand originates, how prospects move through the funnel, which activities influence pipeline, and where investment should change.
For growth-stage SaaS companies, professional service firms, startups, and businesses expanding in the U.S., this distinction is critical. Demand generation should not be reported as activity alone. It should be connected to the commercial system.
Why Leadership Distrusts Marketing Data
Executives often distrust marketing reports because the reports answer different questions from those leadership needs answered.
A marketing dashboard might show impressions, clicks, engagement, traffic, downloads, or leads. A CEO or revenue leader is more likely to ask:
- Which activities are creating qualified opportunities?
- Which channels influence pipeline?
- What happened to leads after they entered the CRM?
- Which campaigns contributed to closed revenue?
- Where is the funnel losing potential customers?
- Are we investing in the right segments?
The problem is not that marketing metrics are useless. The problem is that metrics become disconnected from business decisions.
A strong b2b marketing attribution model should therefore connect marketing interactions with meaningful stages such as:
Visitor → Lead → Qualified Lead → Opportunity → Closed Revenue
This creates a common language between marketing, sales, RevOps, and leadership.
For example, a B2B SaaS company may generate 500 leads from several campaigns. That number alone says little about business value. If only 20 become qualified opportunities and three become customers, leadership needs to understand why.
The Executive Data Test
Before including a metric in a leadership report, ask:
| Question | If the answer is yes |
| Does it connect to a business objective? | Keep it |
| Can someone act on it? | Keep it |
| Does it explain pipeline movement? | Prioritize it |
| Does it only describe activity? | Consider moving it to an operational dashboard |
| Is its definition consistent across teams? | Keep and document it |
The objective is not to eliminate marketing data. It is to organize it around decisions.
Core Analytics Stack Components
A practical demand generation analytics stack does not need to be unnecessarily complicated. It needs clear data ownership and consistent definitions.
The core components generally include:
| Layer | Purpose | Example data |
| Website analytics | Understand acquisition and behavior | Traffic, landing pages, conversions |
| Advertising platforms | Measure paid acquisition | Spend, clicks, conversions |
| Marketing platform | Track engagement | Campaigns, forms, email, content |
| CRM | Track commercial progression | Leads, opportunities, pipeline, revenue |
| Sales data | Connect activity to revenue | Meetings, stages, close rates |
| Reporting layer | Create management visibility | Funnel, channel, revenue dashboards |
A company may use different tools, but the architecture should remain connected.
For example, growth marketing services may generate demand through paid search, LinkedIn, content, webinars, or outbound campaigns. The reporting system should allow the team to understand not only which channel generated activity, but what happened after the initial interaction.
This is particularly important when evaluating account based marketing vs demand generation. Account-based programs may focus on engagement within specific accounts, while broader demand generation may measure audience reach, conversion, qualification, and pipeline creation.
Similarly, a lead scoring model b2b should not exist independently from sales qualification. If marketing defines a high-quality lead differently from sales, reporting becomes difficult to trust.
Minimum Reporting Framework
A useful reporting stack should answer five questions:
- Acquisition: Where did demand originate?
- Engagement: What did prospects interact with?
- Qualification: Which prospects became sales-worthy?
- Pipeline: Which activities influenced opportunities?
- Revenue: Which efforts contributed to commercial outcomes?
This creates a reporting structure that leadership can use rather than simply review.
Connecting Marketing Data to Revenue
The most important transition in demand generation analytics is moving from activity reporting to revenue-connected reporting.
Consider two reports.
Report A
- 40,000 impressions
- 2,000 website visits
- 300 leads
- 8% conversion rate
Report B
- 300 leads
- 42 qualified opportunities
- $620,000 pipeline influenced
- 11 closed customers
- $185,000 closed revenue
Both contain useful information. But Report B gives leadership greater context for commercial decision-making.
A mature reporting system should connect the customer journey across systems. HubSpot, for example, describes attribution reporting as a way to analyze interactions throughout the customer journey and supports multiple attribution models for assigning credit.
Salesforce similarly provides B2B analytics capabilities covering pipeline, revenue, lead volume, conversions, campaign performance, and multi-touch attribution.
Revenue Connection Framework
Use this sequence:
Marketing Activity → Qualified Demand → Sales Acceptance → Opportunity → Pipeline → Closed Revenue
For every major channel, ask:
- How much qualified demand did it create?
- What percentage became opportunities?
- What pipeline value was associated with those opportunities?
- What revenue eventually closed?
- How long did conversion take?
This does not mean every revenue outcome can be perfectly attributed to one marketing activity. B2B buying journeys involve multiple interactions. Attribution should therefore be treated as a decision-support system rather than an absolute statement of causation.
For a SaaS company, this might mean comparing product-focused content, paid search, webinars, and LinkedIn activity based on their contribution to qualified opportunities.
For a professional services company, it might mean comparing organic search, referrals, executive content, webinars, and outbound campaigns based on qualified conversations and resulting opportunities.
Building Executive-Ready Reports
An executive dashboard should prioritize clarity over volume.
Leadership typically needs three layers.
Layer 1: Business Outcomes
- Pipeline generated
- Pipeline influenced
- Revenue generated
- Revenue influenced
- Customer acquisition cost
- Conversion rates
- Sales cycle
Layer 2: Funnel Performance
- Leads
- Marketing-qualified leads
- Sales-qualified leads
- Opportunities
- Opportunity-to-customer conversion
- Funnel leakage
Layer 3: Channel and Campaign Insights
- Organic
- Paid
- Events
- Content
- Account-based programs
- Partner activity
The report should then answer:
What changed, why did it change, and what should we do next?
That is more valuable than presenting 30 charts without interpretation.
Executive Dashboard Checklist
Before sending a monthly report, verify:
- Metric definitions are consistent.
- Marketing and sales data are reconciled.
- Pipeline values are current.
- Revenue is separated from pipeline.
- Attribution methodology is documented.
- Major funnel changes are explained.
- Channel performance is compared against business objectives.
- Key actions are clearly identified.
For organizations using digital marketing consulting services, B2B marketing, or performance marketing services USA, this discipline is particularly important because multiple channels can create overlapping customer journeys.
Common Reporting Mistakes
Several reporting problems repeatedly reduce confidence in marketing analytics.
1. Reporting activity instead of outcomes
High traffic or engagement does not automatically indicate commercial impact.
2. Changing definitions
If “qualified lead” means one thing in January and something else in March, trend analysis becomes unreliable.
3. Treating attribution as absolute truth
A multi-touch model assigns credit according to a defined methodology. It should inform investment decisions, not be presented as perfect causality.
4. Ignoring sales data
Marketing cannot demonstrate pipeline impact if CRM stages and revenue outcomes are excluded.
5. Creating dashboards without decisions
Every major metric should support a question, decision, or action.
6. Overloading leadership
A dashboard containing every available metric can hide the few indicators that matter.
7. Measuring channels in isolation
A prospect might discover a company through search, read a blog, attend a webinar, engage with LinkedIn content, and later speak with sales. Reporting each channel independently can obscure the actual journey.
The Better Approach
Use one reporting hierarchy:
Business Goal → Revenue Metric → Funnel Metric → Channel Metric → Activity Metric
This hierarchy keeps reporting connected to strategy.
Review Cadence
Reporting becomes useful when it follows a consistent operating rhythm.
| Cadence | Primary purpose | Typical focus |
| Weekly | Operational management | Campaigns, leads, funnel issues |
| Monthly | Performance management | Pipeline, channel performance, conversion |
| Quarterly | Strategic planning | Revenue contribution, budget allocation, growth priorities |
Weekly reporting should help teams identify problems early.
Monthly reporting should help marketing and sales understand performance.
Quarterly reporting should help leadership make resource and strategy decisions.
A growth-stage company may also benefit from a quarterly review of its b2b demand generation metrics to determine whether the measurement framework itself still reflects its business model.
For example, an early-stage SaaS company may initially prioritize qualified conversations and opportunity creation. As its sales organization matures, leadership may need stronger visibility into pipeline velocity, customer acquisition cost, sales-cycle length, and revenue contribution.
This is where growth consulting services, business growth consulting, and growth strategy consulting can add value when reporting problems are actually symptoms of broader strategy, ownership, or measurement issues.
A growth partner such as GrowAnant can help connect reporting architecture with demand generation, go-to-market priorities, and revenue execution rather than treating analytics as an isolated marketing task.
References
Frequently Asked Questions
Executives may distrust dashboards when metrics are disconnected from pipeline, revenue, business objectives, or clearly defined stages. A dashboard becomes more useful when it connects marketing activity to qualified demand, opportunities, pipeline, and revenue.
A typical stack includes website analytics, advertising platforms, marketing automation, CRM data, sales data, and an executive reporting layer. The exact tools can vary. The important requirement is that definitions and data flows remain consistent across systems.
Connect marketing interactions to CRM stages and revenue outcomes. A practical framework is:
Marketing Activity → Qualified Demand → Sales Acceptance → Opportunity → Pipeline → Closed Revenue
Attribution models can then help distribute credit across relevant customer interactions.
Weekly reporting is useful for operational management, monthly reporting for performance management, and quarterly reporting for strategic decisions. The frequency should match the speed at which the business and its demand-generation system change.