
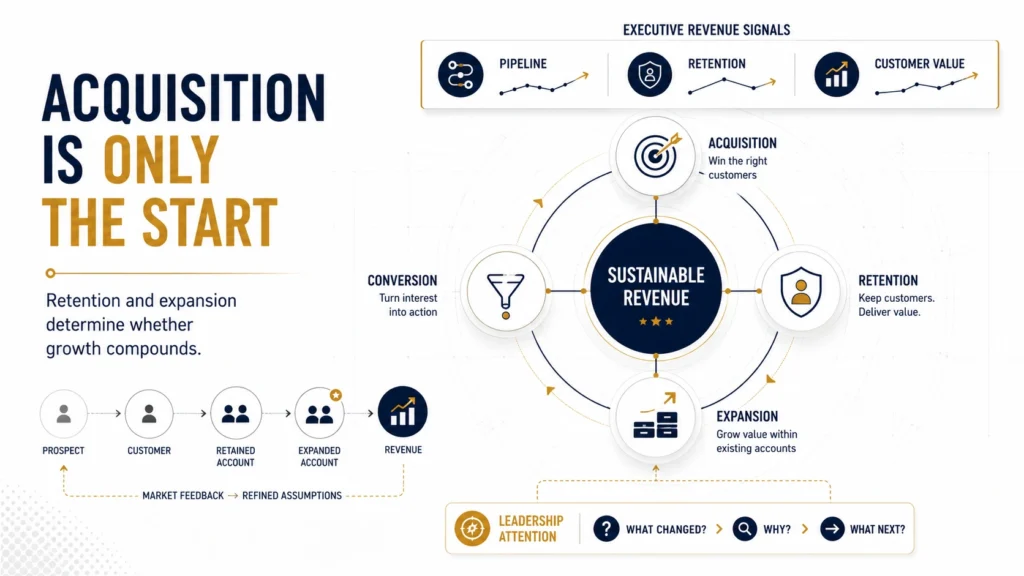
An executive dashboard should help leadership answer one question quickly: Is the company acquiring valuable customers and retaining enough of them to support sustainable growth?
Strong executive dashboard examples customer retention acquisition do not simply place every available KPI on one screen. They connect acquisition, retention, expansion, and revenue so CEOs and Revenue Operations leaders can identify where growth is working, where it is leaking, and where management attention is required.
This is also why growth consultant, fractional growth consultant, and growth strategy consulting engagements often treat dashboards as decision systems rather than reporting documents. A useful dashboard should show what changed, why it matters, and what leadership should investigate next.
Why Retention and Acquisition Belong on One Dashboard
Acquisition and retention are often managed by different teams. Marketing focuses on acquiring customers, while customer success focuses on keeping them. Finance focuses on revenue, and sales focuses on new bookings.
The customer, however, experiences one business.
If acquisition is growing while churn is increasing, headline growth may hide a structural problem. Conversely, if acquisition slows but retention and expansion improve, the business may still be creating stronger customer economics.
McKinsey’s research on B2B commercial analytics emphasizes examining the full customer lifecycle, including acquisition, product-customer fit, pricing, retention, and reacquisition, rather than evaluating commercial performance through isolated metrics.
The Executive Growth Equation
New Customers + Retained Customers + Expansion Revenue = Sustainable Revenue Growth
An executive dashboard should therefore connect:
Acquisition → Conversion → Customer Value → Retention → Expansion → Revenue
| Area | Executive Question |
| Acquisition | Are we attracting enough qualified customers? |
| Conversion | Are prospects progressing efficiently? |
| Customer value | Are acquired customers economically valuable? |
| Retention | Are customers staying? |
| Expansion | Are existing accounts increasing their value? |
| Revenue | Is the model producing sustainable growth? |
This integrated view is particularly important for SaaS companies, professional services firms, and growth-stage businesses where increasing acquisition spending without understanding retention can create inefficient growth.
Acquisition Metrics to Include
An executive dashboard should prioritize acquisition metrics that explain the quality and economics of new customer growth.
Core Acquisition Metrics
| Metric | What It Shows | Executive Use |
| New customers | Customer growth | Tracks acquisition output |
| Customer acquisition cost | Acquisition efficiency | Evaluates spending |
| Qualified pipeline | Future revenue potential | Assesses demand health |
| Pipeline conversion | Funnel efficiency | Identifies leakage |
| Win rate | Sales effectiveness | Evaluates commercial execution |
| Average deal size | Revenue per customer | Supports forecasting |
| Sales cycle | Time to revenue | Identifies friction |
| Channel contribution | Source performance | Guides investment |
The important distinction is between activity metrics and decision metrics.
Website traffic, impressions, clicks, and lead volume may be useful diagnostic indicators. But executives generally need to understand whether those activities produce qualified pipeline and economically viable customers.
For example:
A company may generate 2,000 monthly leads while qualified pipeline remains flat.
The dashboard should not simply report the lead increase as positive growth. It should highlight the disconnect between volume and commercial value.
Acquisition Quality Framework
Use four questions:
Volume: Are enough prospects entering the funnel?
Quality: Are they the right prospects?
Conversion: Are they progressing?
Economics: Is acquisition cost justified by customer value?
This prevents leadership from rewarding lead volume when the underlying customer economics are deteriorating.
Retention & Expansion Metrics to Include
Acquisition tells leadership how customers enter the business. Retention tells leadership whether the business is delivering enough value to keep them.
HubSpot identifies metrics such as customer retention rate, churn rate, repeat purchase ratio, and customer lifetime value as important retention measures, while its customer-success guidance also highlights GRR, NRR, product adoption, customer health, and churn.
For recurring-revenue businesses, the executive view should generally include:
- Customer retention rate
- Customer churn
- Revenue churn
- Gross revenue retention
- Net revenue retention
- Customer lifetime value
- Expansion revenue
- Product adoption
- Customer health
- Customer satisfaction
Retention vs Expansion
| Metric | Primary Question |
| Customer retention | Are customers staying? |
| Revenue retention | How much revenue remains? |
| Gross revenue retention | How much recurring revenue remains before expansion? |
| Net revenue retention | Is the existing customer base growing or shrinking? |
| Expansion revenue | Are customers increasing their spend? |
| Customer lifetime value | What is the economic value of retained customers? |
| Customer health | Which accounts may be at risk? |
Consider a B2B SaaS company that acquires 100 new customers in a quarter.
That number looks positive.
But if larger customers are churning, expansion is declining, and customer acquisition cost is increasing, the company may be growing less efficiently than the acquisition figure suggests.
A combined dashboard makes that relationship visible.
The Retention-to-Acquisition Connection
One of the most useful executive views is to compare acquisition cohorts with their subsequent retention.
For example:
Acquisition Channel → Customer Segment → Initial Revenue → 90-Day Retention → Expansion → Lifetime Value
This can reveal that one channel generates fewer customers but substantially stronger customer economics.
That insight can change budget allocation more effectively than simply comparing lead counts.
Designing for Executive Readability
The question is not how much data an executive dashboard can display.
The question is how little information leadership needs to make a better decision.
HubSpot recommends keeping KPI dashboards focused, noting that five to ten meaningful metrics can be more useful than a crowded dashboard. Its current dashboard guidance also emphasizes metrics such as revenue, CAC, CLV, pipeline, win rate, and sales cycle depending on the business objective.
A Practical Executive Dashboard Structure
Section 1: Revenue Health
- Revenue
- Growth rate
- Forecast
- Gross margin where relevant
Section 2: Acquisition
- New customers
- Qualified pipeline
- CAC
- Win rate
Section 3: Retention
- Churn
- Retention rate
- GRR
- NRR
Section 4: Expansion
- Expansion revenue
- Customer lifetime value
- Upsell or cross-sell contribution
Section 5: Executive Alerts
- Biggest positive movement
- Biggest negative movement
- Primary growth constraint
- Required decision
The final section is frequently missing.
A dashboard becomes more valuable when it moves from:
“Here are the numbers.”
to:
“Here is what changed, why it matters, and where leadership needs to act.”
Executive Dashboard Decision Framework
For every metric, ask:
- What decision does this metric inform?
- Who owns the outcome?
- What constitutes healthy performance?
- What change should trigger investigation?
- What action follows the signal?
If a metric has no associated decision, it may belong in an operational dashboard rather than the executive view.
This is one way how executive growth dashboards improve strategic decision-making becomes tangible: the dashboard reduces the distance between business signals and management action.
Review Cadence
Different metrics require different review frequencies.
An executive dashboard should not encourage leadership to react to every daily fluctuation.
Recommended Cadence
| Review | Frequency | Primary Focus |
| Operational | Daily/weekly | Immediate issues |
| Functional | Weekly | Funnel and team performance |
| Executive | Monthly | Growth, retention, economics |
| Strategic | Quarterly | Business model and allocation |
For example, a marketing team may monitor campaign conversion daily. A CEO should usually focus more on monthly changes in qualified pipeline, CAC, customer retention, revenue, and forecast.
McKinsey describes commercial dashboards as a central source of truth that can support regular performance reviews and action-oriented discussions across leadership levels.
Monthly Executive Review Framework
1. What changed?
Identify meaningful movements.
2. Why did it change?
Separate correlation from the most credible business drivers.
3. What does it affect?
Connect the metric to pipeline, revenue, customer value, or operating efficiency.
4. What should change next?
Define an owner and action.
5. What should leadership monitor?
Identify the next signal that will confirm whether the action is working.
This approach is particularly useful for revenue growth consulting, growth consulting services, and broader business growth consulting because it connects strategic recommendations with measurable operating outcomes.
Common Mistakes
1. Including Too Many Metrics
More metrics can create less clarity.
2. Mixing Operational and Executive Metrics
Executives do not need every campaign-level metric on the same dashboard.
3. Ignoring Retention
Acquisition without retention can create the appearance of growth without sustainable customer economics.
4. Tracking Revenue Without Drivers
Revenue should be connected to acquisition, conversion, retention, expansion, and pricing where relevant.
5. Using Vanity Metrics
Impressions, traffic, followers, and raw lead volume can be useful diagnostics, but they should not dominate executive reporting.
6. Reporting Without Ownership
Every material metric should have a responsible owner.
7. Failing to Segment
Overall averages can hide major differences between customer segments, acquisition channels, products, or geographies.
8. Treating the Dashboard as a Static Report
A dashboard should evolve as business priorities change.
For example, a startup focused on product-market fit may emphasize activation and retention, while a scaling SaaS company may place greater emphasis on CAC efficiency, pipeline coverage, NRR, and expansion.
A strategic growth partner such as GrowAnant can use an executive dashboard as part of a broader growth system, connecting growth strategy consulting, demand generation, acquisition, retention, and revenue decisions instead of treating reporting as a standalone activity.
References
HubSpot
Customer Retention Metrics: How to Measure and Improve Retention
McKinsey & Company
Insights to Impact: Creating and Sustaining Data-Driven Commercial Growth
Frequently Asked Questions
Acquisition and retention should be viewed together because customer growth only creates sustainable value when the business can acquire customers efficiently and retain their economic value. Combining the two helps leadership identify whether growth is being created through healthy customer economics or simply through increased acquisition activity.
Prioritize metrics such as new customers, qualified pipeline, CAC, conversion rates, win rate, average deal size, sales cycle, and channel contribution. The exact mix should depend on the business model and the decisions leadership needs to make.
Core metrics can include customer retention rate, churn, revenue churn, GRR, NRR, customer lifetime value, expansion revenue, product adoption, and customer health. For SaaS businesses, retention and expansion metrics are particularly important because future revenue depends heavily on the value of the existing customer base.
An executive dashboard should show a limited set of high-value metrics, clear trends, relevant comparisons, and meaningful exceptions. Each metric should help leadership understand performance or make a decision.
Operational metrics can be reviewed weekly or more frequently, while executive dashboards are generally more useful when reviewed monthly and used for deeper quarterly strategic planning. The cadence should match the speed at which meaningful business changes occur.
Common mistakes include overcrowding the dashboard, focusing on vanity metrics, separating acquisition from retention, failing to segment data, reporting without ownership, and presenting numbers without explaining their business implications.